|
VERIZON NY 2020 ANNUAL REPORT EXCEL SPREADSHEET DOWNLOAD |
IRREGULATOR WALK-THROUGH |
ARY FINDINGS
(Source: Verizon New York 2020 Annual Report, published May 28th, 2021)
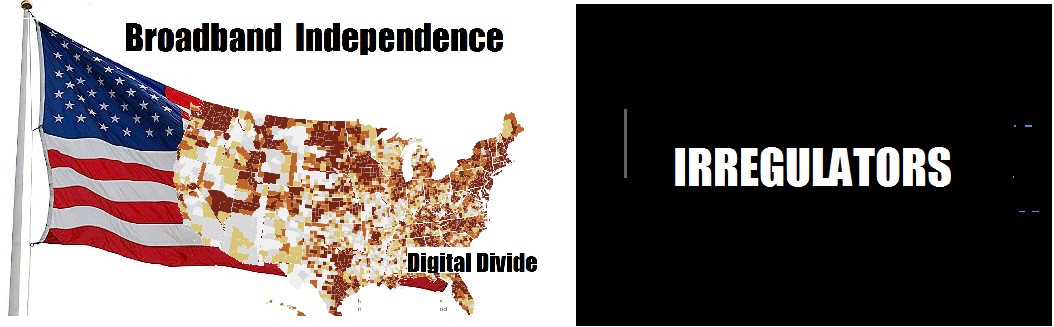
The Verizon NY 2020 Annual Report was published on May 28th, 2021 and it is New York State’s primary telecommunications public utility. And it is not simply the copper wire infrastructure used for phone service, but it also the fiber optic wires used for the FTTP, fiber to the premises, for FiOS. Since 2010, Verizon has been diverting the state utility-wired construction budgets to fund Verizon Wireless and the other Verizon subsidiaries—creating the Digital Divide.
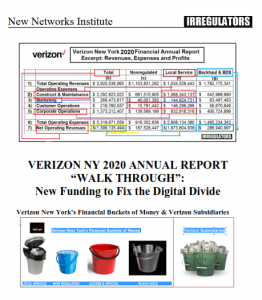
Verizon New York 2020 Annual Report
- Revenues of over $3.9 billion but had expenses of $5.3 billion, creating Net Operating “losses” of $1.4 billion.
- Local Servic had $1 billion in revenues, representing 26% of the total and are the basic wireline Plain Old Telephone Service, “POTS”. Ar the end of 2018 there were 1.9 million phone access lines in service in just Verizon NY.
- (NOTE: The information on the number of access lines has been redacted in the 2019 and 2020 Annual Reports. NOTE 2: This information has been manipulated to leave out 50-80% of all access lines in service.)
- Local Service, alone, lost an alleged $1.9 billion, creating the total losses for Verizon NY, of $1.4 billion.
- Verizon received federal and state tax benefits, over $½ billion from these losses.
- Local Service was charged 55% of all expenses and 42-67% of total expenses for specific expense items.
- Local Service was charged $833 million, 61%, in Corporate Operations expense, which is 81% of the Local Service revenues.
- Local Service was charged $144 million in Marketing expenses, 54% of the total—Verizon no longer markets basic phone service.
- Local Service was charged $1.1 billion in Construction & Maintenance, yet it spent only an estimated $75-$100 million for maintaining and upgrading the copper networks. Where did the $1 billion in overcharging go?
Meanwhile
- “Backhaul” Services (including “Access Services”, “Business Data Services”, and “Special Access”) represented $1.8 billion in revenues, (45%), but only paid 28% of expenses; i.e., Backhaul had double the revenues by paid ½ the expenses.
- “Nonregulated” services (which include formerly regulated or not regulated services, such as FiOS video and VOIP), were $1.1 billion in revenues, but paid a fraction of all other costs as compared to Local Service.
- Local Service paid 263% more in Marketing expenses than Nonregulated services 826% more in Customer Operations expenses, 497% more Corporate Operations expense 217% more in overall expenses.
Overcharging: A Partial List:
- Local Service was Overcharged an Estimated $925 Million in Corporate Operations and Marketing Expenses, in Just New York, in Just 2020. These 2 expenses were 95% as compared to Local Service revenues. We estimate only $50 million of the $977 million ($833 million +$144 million) could be considered legitimate.
- Verizon NY Local Service was Overcharged an Estimated $1.02 Billion due to the Construction and Maintenance Expenses Put into Local Service.
- Local Service paid 73% in “network construction in progress” expenses while only 11% of the total was charged to ‘nonregulated’, (which includes FiOS and VoIP.)
- Tax Avoidance and Rate Increases based on artificial losses, underpayments from all of the Verizon affiliates and lines of business—- needs to be investigated and halted.
In short, for just these few basic expense areas, Verion NY Local Service was overcharged almost $1.9 billion dollars in 2020, and this does not include the other areas we identified.
See our other reports and analyses: http://irregulators.org/reading-library/
- Harvesting’ Customer Impacts
- Backhaul monopoly profits and the price of America’s communications services
- Broadband commitments and failure to upgrade impacts
- Fixing the Digital Divide
- Big Telecom & Cable Impacts