DONATE TO HELP US CONTINUE
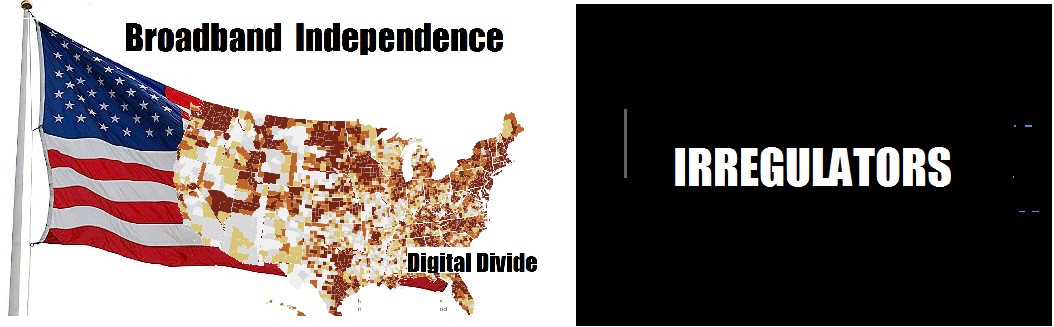
Read the Story Rattle the Cage $20 billion annually to fix the Digital Divide
Estimated Partial Annual Overcharging of AT&T, Verizon & CenturyLink Local Service Utilities, by State, 2019, and 5-Year, 2015-2019
We have created a series of reports and summary articles to supply documentation pertaining to the Verizon NY financials.

Nationwide:
- Local Service category has paid $28 billion in these 3 expense areas, Construction & Maintenance, Corporate Operations expense and Marketing.
- Should have paid between $4.9 billion to $12.3 billion.
- Overcharged $15.6 to $22.9 billion dollars in just 2019.
FULL CALCULATION BY STATE*
| UTILITY | STATE | 2019 LOW | 2019 MEDIUM | 5-YEAR (2015-2019 |
| AT&T | Alabama | $ 349,799,833 | $ 237,807,945 | $ 1,469,019,446 |
| CenturyLink | Arizona | $ 379,654,960 | $ 258,104,657 | $ 1,594,399,041 |
| AT&T | Arkansas | $ 147,691,514 | $ 100,406,610 | $ 620,245,309 |
| AT&T | California | $ 2,437,728,664 | $ 1,675,938,457 | $ 10,284,167,803 |
| CenturyLink | Colorado | $ 517,364,073 | $ 355,687,800 | $ 2,182,629,681 |
| AT&T | Delaware | $ 90,150,358 | $ 61,287,826 | $ 378,595,462 |
| Verizon- | D.C Washington | $ 164,510,830 | $ 111,841,055 | $ 690,879,714 |
| AT&T | Florida | $ 1,675,278,689 | $ 1,138,921,590 | $ 7,035,500,697 |
| AT&T | Georgia | $ 674,436,525 | $ 458,508,978 | $ 2,832,363,758 |
| Frontier | Hawaii | $ 111,933,029 | $ 76,096,559 | $ 470,073,970 |
| CenturyLink | Idaho | $ 114,103,157 | $ 77,571,899 | $ 479,187,640 |
| AT&T | Illinois | $ 932,665,376 | $ 641,207,446 | $ 3,934,682,053 |
| AT&T | Indiana | $ 533,289,806 | $ 362,551,782 | $ 2,239,603,969 |
| CenturyLink | Iowa | $ 194,559,439 | $ 132,269,304 | $ 817,071,856 |
| AT&T | Kansas | $ 198,492,355 | $ 136,463,494 | $ 837,389,624 |
| AT&T | Kentucky | $ 292,859,522 | $ 199,097,640 | $ 1,229,892,905 |
| AT&T | Louisiana | $ 330,802,353 | $ 224,892,696 | $ 1,389,237,623 |
| Verizon- | Maryland | $ 628,074,661 | $ 426,990,325 | $ 2,637,662,465 |
| Verizon- | Massachusetts | $ 648,581,839 | $ 445,900,014 | $ 2,736,204,633 |
| AT&T | Michigan | $ 744,424,391 | $ 506,089,534 | $ 3,126,284,813 |
| AT&T | Minnesota | $ 278,421,948 | $ 189,282,398 | $ 1,169,260,865 |
| AT&T | Mississippi | $ 206,739,519 | $ 140,549,811 | $ 868,223,325 |
| CenturyLink | Montana | $ 53,480,098 | $ 36,357,914 | $ 224,595,031 |
| CenturyLink | Nebraska | $ 93,594,293 | $ 63,629,151 | $ 393,058,611 |
| AT&T | Nevada | $ 219,282,868 | $ 149,077,281 | $ 920,900,373 |
| Verizon- | New Jersey | $ 883,200,054 | $ 607,200,037 | $ 3,726,000,228 |
| CenturyLink | New Mexico | $ 157,164,498 | $ 106,846,724 | $ 660,028,054 |
| Verizon- | New York | $ 1,603,940,365 | $ 1,090,422,939 | $ 6,735,908,260 |
| AT&T | North Carolina | $ 701,411,266 | $ 476,847,488 | $ 2,945,646,886 |
| CenturyLink | North Dakota | $ 21,028,112 | $ 14,295,753 | $ 88,309,664 |
| AT&T | Ohio | $ 922,429,701 | $ 627,104,677 | $ 3,873,835,945 |
| AT&T | Oklahoma | $ 224,837,176 | $ 152,853,323 | $ 944,226,246 |
| CenturyLink | Oregon | $ 215,683,486 | $ 148,282,397 | $ 909,914,709 |
| Verizon- | Pennsylvania | $ 884,463,075 | $ 608,068,364 | $ 3,731,328,597 |
| Verizon- | Rhode Island | $ 67,224,929 | $ 45,702,201 | $ 282,317,827 |
| AT&T | South Carolina | $ 253,308,877 | $ 172,209,526 | $ 1,063,796,007 |
| CenturyLink | South Dakota | $ 26,807,016 | $ 18,224,484 | $ 112,578,748 |
| AT&T | Tennessee | $ 416,734,804 | $ 286,505,177 | $ 1,758,099,952 |
| AT&T | Texas | $ 1,747,462,440 | $ 1,201,380,428 | $ 7,372,107,170 |
| CenturyLink | Utah | $ 156,789,279 | $ 106,591,635 | $ 658,452,286 |
| Verizon- | Virginia | $ 736,442,803 | $ 500,663,331 | $ 3,092,765,336 |
| CenturyLink | Washington | $ 479,128,091 | $ 325,730,478 | $ 2,012,146,422 |
| Verizon- | West Virginia | $ 134,197,447 | $ 91,232,802 | $ 563,575,622 |
| AT&T | Wisconsin | $ 337,806,435 | $ 229,654,352 | $ 1,418,651,967 |
| CenturyLink | Wyoming | $ 36,470,185 | $ 24,793,893 | $ 153,160,194 |
| United States | $22,647,503,957 | $ 15,464,719,132 | $ 95,280,557,723 |
The calculations for each state are based on a model developed from the the Verizon New York 2019 Annual Report, published June 8th, 2020 and the previous decade of state-based annual reports, SEC-based quarterly filings for the Verizon territories, last published in 2010, and the last published data from FCC’s ARMIS information, supplying Revenues, Access Lines in 2007.
Moreover, these are ‘partial’ estimated overcharging examining only 3 primary expense areas: Corporate Operations Expenses Construction & Maintenance and Marketing expenses applied to Local Service which were also supplied in the FCC’s state-based ARMIS 2007 database.
The Verizon NY Annual Reports show that NY State is still applying the FCC’s deformed cost accounting formulas, that are federal and set to reflect the year 2000, The last available FCC data, by state, revealed that all of the state utilities had been using these deformed formulas that now put 40%-75% of all expenses into Local Service, while the other lines of business, such as Wireless are being illegally cross-subsidized.
“Low Scenario 2019” is created based on applying the actual expenses that were generated by Local Service. For example, Local Service is revenues from basic phone service yet was charged $205 million in Marketing, which was 54% of the total charged to Verizon New York. When was the last time you saw an advertisment for basic, copper-based phone service? Moreover, Local Service paid $1.2 billion in construction and maintenance yet it only spent approximately -5 million. (Alprazolam) The different, the overcharge, was used by the wireless service, it appears and not to upgrade and maintain the state utility infrastructure.
The “Medium Scenario 2019” is based on assigning these basic expenses to Local Service based on the percentage of revenues. Local Service was about 21% of the total revenues and it therefore should pay 21% of the expenses. Instead, Local Service was charged 61% of the total Corporate Operations expenses of $507 million. In 2017, Local Service paid $1.8 billion in corporate operations which was also 61% of the total charged to Verizon NY
The “5 year, 2015-2019” takes the calculations by year for Verizon NY 2019 Annual Report and applies a formula that takes the 2 scenarios and merges them per year.
On March 13, 2020, IRREGULATORS v FCC delivered the decision that has freed the States – the states are now independent from the FCC and can remove the financial overcharging and cross-subsidies, saving America an estimated $16-$23 billion dollars annually that can now be used to solve the Digital Divide.
*Note: This accounting has multiple variables as we decided to return to examine each state’s potential estimated partial overcharging, but as it clear, the original analysis is within a rounding calculation—and the FCC’s own supplied financial information has major anomolies between the different areas of the same report.